Azure Defender for DevOps – First Impressions

The recent batch of high profile security incidents at various companies in Australia highlights the need for appropriate security measures across all components of an organisation’s infrastructure. Defender for DevOps is a new functional addon (in preview) to Defender for Cloud. It provides security functionality for your code respositories and associated components.

Setup

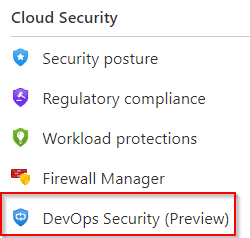
When navigating to the Defender for Cloud interface, a new option will appear under the “Cloud Security” heading.

The new DevOps Security option

Once we click on this, we are presented with an intro splash page with steps to getting started. The first step is to connect to the environments. Both Azure DevOps and Github repositories are supported environments.

The DevOps Security landing page

After clicking on the Add Connector button, we are presented with the Environment settings page. I found this screeen a bit confusing as it wasn’t immediately obvious how to see the new environment. The documentation (at the time of writing this post) doens’t cover this stage of setup. The trick is to click on the Add Environment button and select the appropropriate option. In my case, I’ll use Azure DevOps.

Adding a new environment

Next we are presented with a standard style of wizard for setting up a new Azure resource, with the first page asking for a name, subscription, resource group and region. As the form indicates, the only available region is Central US.

The first page of the wizard

The next step of the wizard lists what plan to use. At the moment this section is fairly basic and the plan is free. There will probably be more options when this offering goes live.

The Plan Selection Screen

The third step is to authorise Defender for DevOps on the target. An authorise button is presented.

The Authorisation screen

When the button is clicked, a window will appear with details of what permissions will be needed. The majority of the permissions are only read, but a few are write access as well. If all this is ok, click the Accept button at the bottom. The Authorisation Connection screen will now have some additional details, such as the organisation and what projects should be used. A summary of the permissions are also listed. I opted to use the auto-discovery option to cover all projects.

Organisations and Projects options

Lastly, like every Azure wizard, we get a Review and create screen with a create button. For me, the creation process took about 3 minutes. Once done, we are redirected back to the Environment settings screen. The Azure DevOps item is now listed.

Connection Setup Complete

If we go back to the Defender for Cloud interface, the DevOps Security blade should be updated with an overview of our environment. At this stage, it won’t really show much of value because further configuration is needed.

The Overview interface

Pipeline Configuration

The second item on the Get Started list was about configuring pipelines. For Azure DevOps, this means installing an extension. Navigate to Azure DevOps and click on the shopping bag icon in the top right, then Manage Extensions.

Getting to the Manage Extensions interface

At this point, the Microsoft documentation indicated that the extension should be listed under the Shared tab. For me, this area was blank. So I clicked on the Browse Marketplace button and was able to find it.

Searching the Marketplace

At this point, we can click on it, review the information and install it. At this point, we can create a new pipeline or edit an existing one to use the new tasks provided by the extension. To start with, I’ll use the example provided by Microsoft’s documentation.

# Starter pipeline
# Start with a minimal pipeline that you can customize to build and deploy your code.
# Add steps that build, run tests, deploy, and more:
# https://aka.ms/yaml
trigger: none
pool:
  vmImage: 'windows-latest'
steps:
- task: UseDotNet@2
  displayName: 'Use dotnet'
  inputs:
    version: 3.1.x
- task: UseDotNet@2
  displayName: 'Use dotnet'
  inputs:
    version: 5.0.x
- task: UseDotNet@2
  displayName: 'Use dotnet'
  inputs:
    version: 6.0.x
- task: MicrosoftSecurityDevOps@1
  displayName: 'Microsoft Security DevOps'

To test the pipeline, I ran it on a repository that had some basic Bicep templates. Using this basic template, it appears to install all the toolset used by Defender for DevOps. While the task doing the install and scan took only 1 minute 20 seconds for me, it may take longer for larger repositories. One of these default tools is the ARM Template Best Practice Analyser. This tool actually ran over the Bicep files in the target repository. I’m not sure if it was because my Bicep files were genuinely bad or were mangled in the Bicep-to-ARM conversion process, but it did result in a bunch of errors.

Fortunately it’s possible to add some constraints to the tools used in the pipeline by specifying a category. The Microsoft documentation only mentions IaC as a category. Even when enabling this, it seemed to install the same tools and generate the same amount of logging. The logging can be quite verbose. Fortunately, task will publish results in the SARIF format. Since this is a standardised format, you could run it through the SARIF Azure DevOps extension or pass it onto security tools that can read it.

Another example of focused scanning is for secrets. This is done by setting the category value to “secrets” in the pipeline code. When I put a variable named “password” in one of my Bicep files, the secret scanning picked it up as a potential credential.

Secret scanning log output

There is an extension that can display SARIF file output inline with the pipeline run. When this particular run is viewed in that interface, we get a nice summary of the same items.

The landing page in Defender for Cloud will also update with details of issues as they’re found.

Enabling Pull Request Annotations

So far the visibility of issues may be isolated from developers. They are likely not to have access to the Defender for Cloud interface and they may not always check CI-based pipelines that you might setup to perform general checks on code commits. Defender for DevOps can create visibility in Pull Requests by creating annotations. For Azure DevOps this is done by configuring settings in Azure DevOps itself and Defender for Cloud. For the first area, this requires setting a Build Validation pipeline.

Setting Build Validation Pipeline

The second configuration is in Defender for DevOps. In the landing page, tick all the relevant repositories and click on the Configure button.

Configuring Pull Request Annotations

In the window that appears, set the Pull Request Annotations slider to On. At the moment, the Category and Severity levels are fixed and can’t be changed. Click the Save button.

Enabling Annotations

After configuring all this, we will see some different behaviour when performing a pull request. Firstly, as expected, the Build Validation pipeline will run. If there is an item picked up, it will be added as a comment in the Pull Request, like shown below:

Pull Request Comment

The status of the comment can be changed to values like “Pending”, “Won’t fix”, “Closed”. One issue I did experience with the default settings is that a user can still complete the Pull Request even if an item is found. There’s two possible ways to resolve this. Firstly, the Build Validation pipeline didn’t register a non-successful exit code when it ran so Azure DevOps percieved the validation process as passing. If it had failed, and the validation was set to required, then it would’ve blocked the ability to complete the Pull Request.

The other option is by default, the “Check for comment resolution” setting on repositories is disabled. When set to enable, it will become another check in the process and block completion of the Pull Request.

Comment Resolution block

Final Thoughts

Apart from the initial stumbling block with how to create the connection, the documentation and UI were generally clear and easy to use. The supported file types for the secret scanning is comprehensive and should cover most environments. There appears to be support for scanning container images, but the open source tools used don’t appear to do anything for PowerShell.

The ability to block merge requests is a nice feature to have, as well as the integration back into Defender for Cloud. Some of the options are limited at the moment, so I’ll have to revisit this product when it hits GA status.

Developing a Bicep Validation Pipeline

Azure’s Bicep is Microsoft’s newer format for defining Azure resources as code. In terms of look and feel, it’s very similar to Terraform.. If one considers Bicep files as code, then it would be a natural step to ensure that code meets a certain level of quality. In addition to that level of quality, because Bicep is deploying infrastructure, we would want to ensure that infrastructure is well designed and has a chance of successfully deploying.

When Bicep started to be adopted by the team I was working in, I became involved in designing a process to meet those quality goals as well as reduce the number of deployment issues.

Read more

Registering a VM with Multiple Azure DevOps Environments

Azure DevOps has the concept of Environments, a collection of resources which can be used during a pipeline. At the time of writing the only types of resources that can be used are Virtual Machines and Kubernetes resources. The official documentation on registering a VM resource doesn’t explicitly mention there being any issues with using the same resource across multiple environments, apart from “providing a unique name for the agent”. There’s an important consideration with how the registration process works relating to this.

Read more

“Could not create SSL/TLS secure channel” error when using self-hosted Azure DevOps Agent

Recently the team I’m in has been getting into Microsoft’s new Bicep language. As part of a release pipeline, the infrastructure was being deployed – in this case an Azure App Service. Then the application code was being deployed using the standard “Azure App Service Deploy” task. At this particular task, it would error out:

Error: Could not complete the request to remote agent URL 'https://<App Service Name>.scm.azurewebsites.net/msdeploy.axd?site=<App Service Name>'.
Error: The request was aborted: Could not create SSL/TLS secure channel.

The pipeline was being run through our “Default” agent pool, which was a self-hosted agent.

Read more

PowerShell Quality of Life Improvements – PS Repository

In the last post, we were able to create a Release Pipeline that takes checked and signed Powershell code and deploys it to target servers. In some situations, it may not be desirable or viable to have every server configured as a deployment target. Or there may be a need to have an additional amount of control of the modules that a server gets. To deal with these issues, we can look at setting up a PowerShell Respoistory as an intermediatory step.

Setting Up The Respository

The Respository can be as simple as a file share on a server. At the higher end of complexity, it can be a website running NuGet Gallery. For this case, I’ve gone simple. By using a file share, we negate the need for setting up API keys and the like that a NuGet Gallery would need.

Once the PowerShell Respoistory is created, it needs to be registered on the relevant targets. This is achieved using the Register-PSRepository cmdlet, as shown below:

Register-PSRepository -Name psqol -SourceLocation "\\svr14\psrepo\" -PublishLocation "\\svr14\psrepo\" -InstallationPolicy Trusted

If the InstallationPolicy value is set to “Untrusted”, then there will be a user prompt when attempting to install modules from the Repository.

Read more

PowerShell Quality of Life Improvements – Release

Releasing a build is typically the final step in the process of developing code. For PowerShell, this takes the form of getting our signed scripts and modules onto target servers to be available for use. This can be easily achieved in Azure DevOps.

Deployment Groups/Targets

The deployment tasks will run on the targets will recieve the scripts. Before that, a Deployment Group needs to be created. This is done by navigating to Pipelines > Deplyment Groups and clicking “Add new deployment group”. The group needs to be given a name.

Read more

PowerShell Quality of Life Improvements – Automatic Versioning

Once we start doing processes like putting PowerShell code into git repositories, signing it and effectively creating new versions of it, it becomes useful to be able to automatically manage the versioning of our scripts and modules. The version number acts as an easy visual indicator of whether the script is the latest or not.

Introducing Token Replacement

Since the version number will change with each “build”, we will want to put in some sort of place holder value – a token. In my sample module, I change the version value to reference this token:

# Version number of this module.
ModuleVersion = '#{fullVersion}#'

Read more

PowerShell Quality of Life Improvements – Code Signing

PowerShell uses Execution Policies to control whether a script can be run or not. Some of these policies rely on scripts being digitally signed by a trusted publisher. By signing your scripts, you can look at implementing a more restrictive Execution Policy that increases security. The first step in this process is getting a certificate.

Code Signing Certificate

To sign your scripts, you need a special type of certificate, one for code signing. If your scripts will be for internal use only and your organisation has an internal PKI, then using a code signing certificate from that PKI will be enough. If you are writing scripts or modules for consumption by a broader audience, then you’ll need a code signing certificate from a 3rd party Certificate Authority.

Read more